
February 28, 2013 00:04 by
 rasmus
While testing software, it now and then happens that the system you’re testing simply crashes, without leaving any useful information about what and why. In these cases I’ve found the Debug Diagnostic Tool from Microsoft very useful, as this can provide you with detailed information which can help to locate the bug.
Steps to install tool on your test environment:
1. Download from http://www.microsoft.com/en-us/download/details.aspx?id=26798
2. Configure what kind of crashes to detect (in this case the explorer.exe process):
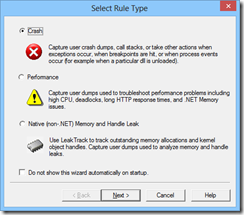
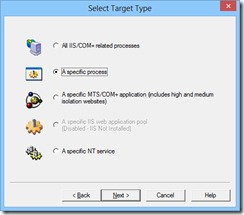
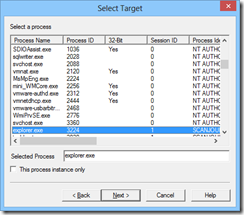
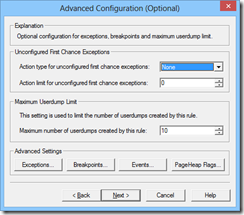
3. Open Tools->Options and Settings… and add your symbols path (in this case I’ve just copied them into “C:\Symbols”):
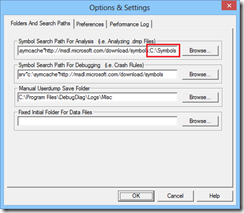
A note here: Make sure you have the same configuration (release/debug) and bitness (32/64 bit) as the binary you want to get stack trace for. Otherwise you won’t get the full details.
4. Trigger the crash and analyze the data to generate a report. In this you will have a stack trace like e.g.
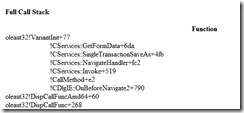
as well as line numbers (if you have symbols loaded) to the right:

Use this tool whenever you experience a crash in your Windows binaries, for which you cannot get other useful information.
f828c403-af1b-4063-a1d1-da51cda85f43|0|.0